P1: Nitrous at Balls in '09
Testing
Simulation Analysis
Last Update, 1/1/09 by Stephen Daniel
Summary
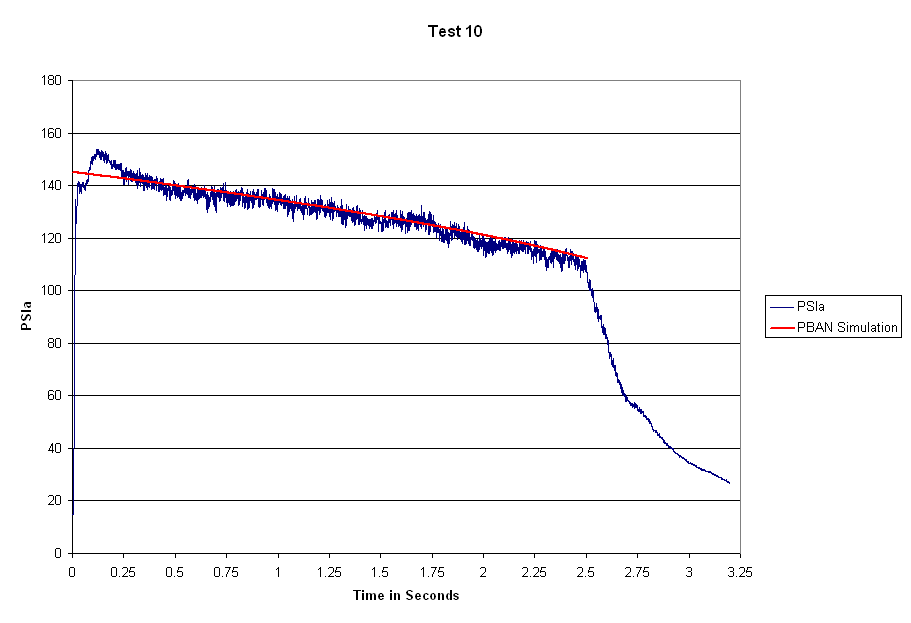
This sections discusses the simulation of test #10. We show that by adjusting the injector Cd, the fuel regression rate, and the C* efficiency we can get a good fit to the burn time, the chamber pressure trace, and the mass of fuel consumed.
Assuming good data and good simulation models, we believe these derived values represent reasonable approximations to reality.
Discussion
We don't have a fuel regression model or CPROPEP entry for ABS, so we used PBAN for both.
We manually adjusted C* efficiency, injector Cd, and a fuel regression constant until the average pressure looked good and the run time and fuel mass consumed matched almost exactly.
The shape of the simulated pressure trace is a good match to the measured, with a couple of exceptions. The motor appears to have had some trouble coming up to pressure immediately. This is visible in the video as well. Test 11 starts instantly. I assume that in test 10 the pyro-valve did not immediately break free.
Early in the burn the chamber pressure is higher than expected. The igniters burn during the entire time the pyro-valve is cooking (about 16.8 seconds) and pre-heat the fuel grain. I assume this results in very high initial fuel regression.
The injector Cd that matches the burn time (0.37) is lower than we've been using for our design work. However our design has been guided by very approximate data. Furthermore we chose to design to a high injector Cd, on the theory that we could alwas add more holes in the injector later. I expect we will need to drill out the injector to achieve our target thrust.
The C* efficiency (72%) is much lower than our design goal of 95%. We believe that switching from a straight length of pipe to a fuel grain cast with mixing chambers forward and aft of the actual grain will significantly improve this.
To match the observed fuel consumed I had to cut the fuel regression almost in half (57.5%). Our fuel regression models suffer from a severe lack of data behind them.
Pressure Graph

Simulation Results
Section 1: Geometry
        Tank Height         0.152 meters
        Tank Volume         1.093 liters
        Ullage Height       0.000 meters
        Grain Length        0.297 meters
        Nozzle Throat       1.000 inches
        Nozzle Exit         1.600 inches
        Nozzle Half Angle   15.0 degrees
        C* Adjustment       0.72
        Cf Adjustment       0.95
        Ambient Pressure    1.0  atm


Section 2: Fill Conditions
        N2O Supply Pressure 508.0 psi
        Init Pressure       415.0 psi
        Init Temp              26 F
        Init N2O Mass        1.01 kg
        Init N2O Density     0.92 g/cc
        N2O Vented to chill  0.08 kg
                             0.18 lbs
        Total N2O Consumed   2.40 lbs
        Fuel                 PBAN


Section 3: Empty Conditions
        Final Pressure      256.8 psi
        Final Temp           -5.1 F
        Ullage N2O Mass      0.05 kg
        Ullage Percentage    5.0 %

Section 4: Chamber Summary   Init  Final   Average
        Grain Port           3.042  3.162  3.104 inches
        Grain Mass           0.442  0.332 kg
        Fuel Consumed               0.110 kg
                              Min     Max     Average
        Chamber Pressure     112.15  145.11  130.52 psi
        O/F Ratio              8.3    9.0    8.7


Section 5: Injector Summary
        Injector Count           8
        Diameter of Injectors    1.78  mm
                                 0.070 inches
        Cd of Injectors          0.37
        Tank/Chamber Pressure Ratio
                                Min     Max    Average
                                2.29    2.86    2.60


Section 6: Nozzle Summary        Min     Max    Average
        Exit Pressure           0.57    0.74    0.67 atm
        Nozzle CF (un-adj)      1.32    1.32    1.32


Section 7: Performance Summary  Init   Min    Max    Average
        Thrust                  139    100    139    122 lbf
                                616    446    616    541 N
        Delivered ISP          1298   1223   1298   1269 meters/sec
        Delivered ISP           132    125    132    129 seconds
        Burn Time             2.508 seconds
        Total Impulse          1357 N-seconds
        Motor Designation     K-541 (6%)